
In the global theatre of finance, Canada is often cast as the protagonist of stability. For over 150 years, the nation has avoided the spectacular banking collapses that have plagued its neighbours to the south—a track record of resilience spanning 1873, 1907, 1930, and 2008. However, as a macroeconomic policy analyst, I see this institutional strength as a double-edged sword. There exists a profound strategic tension in the Canadian economy: the very regulatory architecture and market concentration that ensure Canada’s banking system remains a fortress have simultaneously acted as a trellis for the world’s most overgrown garden of Canadian household debt.
Quick Answer: Canadian household debt is among the highest in the developed world, with total credit market debt exceeding $3.2 trillion in Q4 2025, or roughly 177% of disposable income. Driven largely by mortgage borrowing, debt is growing faster than wages, with household debt-to-GDP at roughly 100%. Many Canadians face, or will soon face, higher debt service costs due to mortgage renewals, which will increase financial strain.
While the “Big Six” banks report record-breaking profits and maintain robust capital buffers mandated by federal regulators, the individuals who populate their ledgers are increasingly leveraged to a breaking point. We have created a paradox in which the institution’s safety is essentially bought at the expense of citizens’ extreme exposure.
While Canada’s banking system is among the most stable globally due to concentrated regulation and limited fragmentation, this same stability has also fostered record-high Canadian household debt. Your deposits are technically safe—protected by institutional strength and the CDIC—but your personal financial health is increasingly vulnerable to interest rate shifts, as the system’s architecture prioritizes bank profitability and institutional capitalization over individual debt sustainability.
To understand the mechanics of this risk, we must first dismantle the long-standing national myth that Canada is immune to the “bailout” culture that defined the 2008 financial crisis. This perception of invulnerability is the primary psychological driver behind two decades of aggressive borrowing.
The $114 Billion Secret: Deconstructing the “No Bailout” Narrative
The historical perception of Canada’s performance in 2008 remains a cornerstone of consumer confidence. The narrative is tidy: while the United States required a $700 billion TARP injection to save a crumbling wall of regional banks, Canada stood firm. However, the 2012 study by the Canadian Centre for Policy Alternatives (CCPA), titled The Big Banks’ Big Secret, reveals that the “no bailout” claim is more a matter of creative semantics than a lack of intervention.
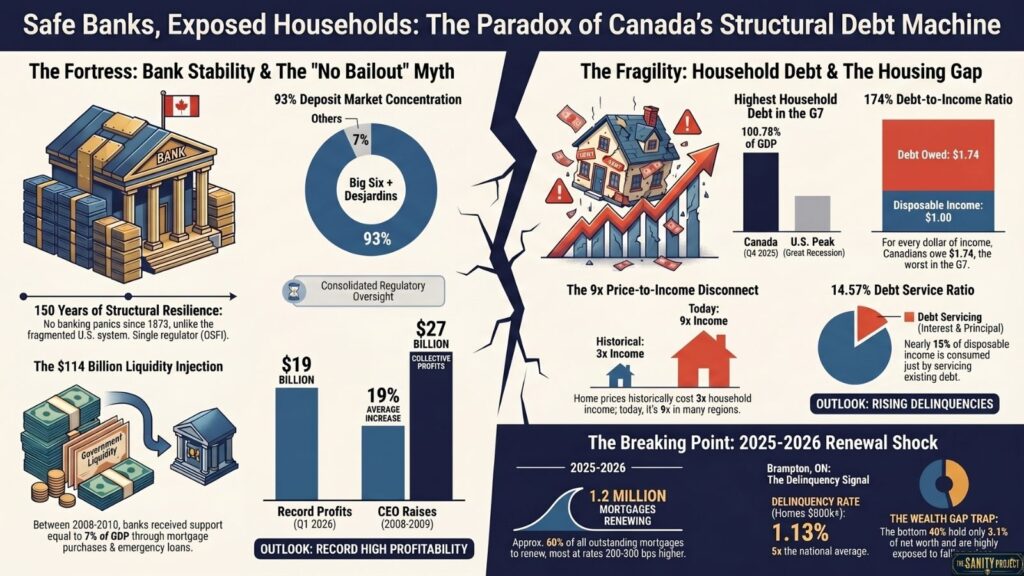
In reality, Canada’s banks received approximately $114 billion in government support—roughly 7% of the nation’s GDP at the time. To put the scale in perspective, aid peaked at different times between October 2008 and June 2010, well after the acute phase of the crisis was supposedly over. The support was funnelled through three distinct channels:
- US Federal Reserve Programs: Approximately $33 billion CAD was accessed by Canadian institutions with US operations through American liquidity facilities.
- Bank of Canada Emergency Loans: A $41 billion program nearly identical in structure to the emergency liquidity programs used by the US Fed.
- CMHC Mortgage Purchases: The Insured Mortgage Purchase Program saw the CMHC buy $69 billion in mortgages from banks, providing them with the cash needed to continue operations.
The “So What?” Layer: The investigative reality is even more jarring than the aggregate figures. At their neediest point, three of Canada’s biggest banks—Scotiabank, BMO, and CIBC—received estimated peak support that equalled or exceeded the value of the entire company. CIBC, in particular, was effectively underwater for the first three months of 2009; it received aid worth 1.5 times its market capitalization. It would have been cheaper for the government to buy every share of the bank than to provide the liquidity support it did.
Yet, because this was labelled “liquidity support” rather than a “capital injection,” the Big Five remained profitable, reporting $27 billion in total profits while their CEOs received an average 19% raise in compensation. This allowed the government to maintain a public narrative of bank self-sufficiency, fueling a psychological environment where Canadian household debt could continue to climb, unburdened by the cautionary tales of systemic failure seen elsewhere.
Hiding in Plain Sight: The Architecture of Canada’s Banking System
The resilience of Canada’s banking system is not an accident of geography; it is a structural byproduct of a 19th-century strategic divergence from the US model. As identified by the National Bureau of Economic Research (NBER), Canada opted for a centralized, branch-based model while the US pursued a fragmented “unit banking” system.
Subscribe To Our Newsletter!
Concentrated Stability vs. Fragmented Risk
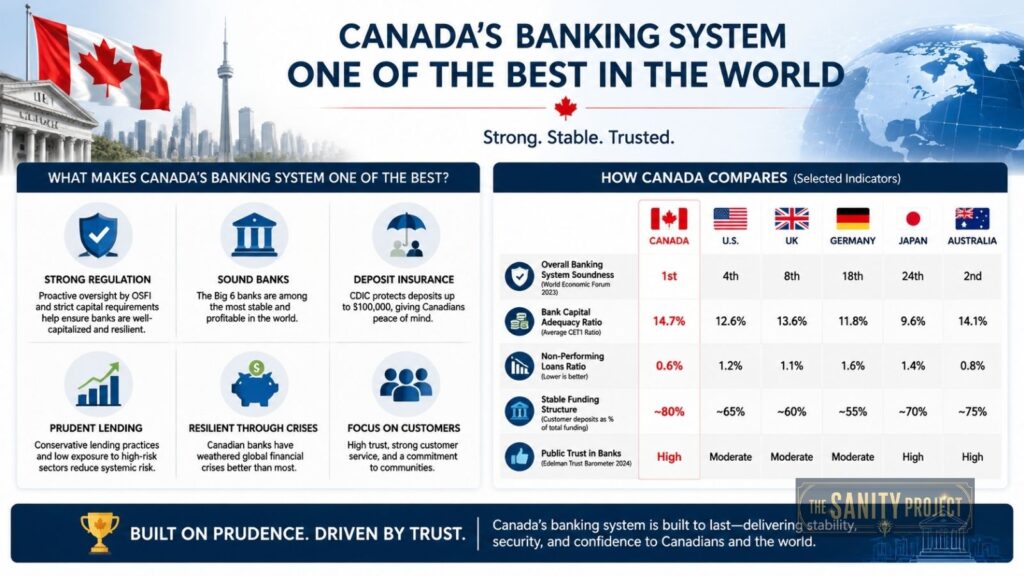
The Canadian “Big Six” oligopoly (RBC, TD, Scotiabank, BMO, CIBC, and National Bank) creates a diversified shield. Unlike the thousands of small US banks vulnerable to local downturns, Canadian banks operate nationally. This branching model allows them to absorb a housing slump in Ontario through profits in the Prairies. Furthermore, the Office of the Superintendent of Financial Institutions (OSFI) acts as a single, powerful regulator. OSFI’s technical rigour is evident in the 2026 Capital Adequacy Requirements (CAR) Guideline, which enforces strict capital buffers, and the current 2027 guideline consultation, which aims to tighten these screws further.
Conservative Lending or Risk Transfer?
While Canadian lending standards are often described as “conservative,” the system functions as a massive risk-transfer mechanism. The Canada Mortgage and Housing Corporation (CMHC) requires mortgage insurance for high-ratio loans, effectively shifting the risk of default from the lender’s balance sheet to the taxpayer. This keeps the banks safe while facilitating the expansion of Canadian household debt by making credit easily accessible. This architecture ensures that if a debt bubble bursts, the institutions remain upright while the individual homeowners bear the brunt of the impact.
The transition from “safe banks” to a “debt machine” is a direct result of this institutional concentration. With the Big Six and Desjardins holding over 93% of the deposit market as of Q2 2025, the lack of competition has enabled the proliferation of easy-to-access credit that is increasingly expensive to carry.

The Debt Machine: Assessing the Magnitude of Canadian Household Debt
Canada now leads the G7 in financial vulnerability metrics, a status that reflects a decade of credit-fueled growth. According to the Statistics Canada national balance sheet report released in March 2026, total household credit market debt has surpassed $3.2 trillion, with mortgage debt alone crossing the $2 trillion milestone.
G7 Financial Vulnerability Metrics (Q4 2025)
| Metric | Canada | G7 Context |
| Debt-to-GDP | 100.78% | Highest in G7 |
| Debt-to-Income | 174% | Highest in G7 |
| Debt Service Ratio | 14.57% | Record High |
The most alarming figure is the 14.57% debt service ratio. This means nearly 15 cents of every dollar of disposable income in Canada is now consumed by debt interest and principal—a structural drag that siphons capital away from the productive economy.
The 2025-2026 Stress Test: A Looming Mortgage Renewal Shock
The “structural debt machine” is colliding with a higher-for-longer interest-rate environment, creating a “Renewal Shock” that serves as the ultimate stress test for the system.
The Renewal Shock and the 300-Basis Point Jump
Data from the Bank of Canada and TD Economics indicate that approximately 60% of all outstanding mortgages (roughly 1.2 million) are set to renew in 2025 and 2026. These borrowers are hitting a “reckoning” as they move from low-rate originations to new contracts that are 200 to 300 basis points higher. This shift represents a massive transfer of wealth from Canadian consumers to the banking sector.
Regional Fault Lines: The Brampton Signal and Beyond
While national delinquency rates remain low in absolute terms (around 0.19-0.22%), the rate of increase is the real signal. The Globe and Mail report on Brampton delinquencies highlights that delinquency rates for high-balance mortgages (800k-1M) in Brampton, Ontario, have hit 1.13%—five times the national average.
However, the instability isn’t confined to Ontario. Saskatchewan currently holds the highest provincial delinquency rate at 0.37%, nearly double the national average. This suggests that the pressure is no longer just an urban Ontario phenomenon; it is a broad geographic reality where the debt machine is beginning to stall.
Divergent Fortunes: Record Bank Profits vs. Household Exposure
There is a widening gap between institutional success and individual struggle. Statistics Canada’s Q3 2025 wealth distribution data shows that while the top 20% of households hold 65.5% of the nation’s net worth, the bottom 40% hold a mere 3.1%. These lower-wealth households carry a disproportionate share of debt and have minimal financial assets beyond their primary residence.
Senator Colin Deacon has raised sharp concerns that the concentration of Canada’s banking system steers capital away from productive innovation and toward the “safe” returns of residential mortgages. This creates a feedback loop: limited competition allows for easy credit expansion, which drives housing prices to a staggering 9x price-to-income ratio (compared to a 3x historical average). This inflation necessitates larger mortgages, which lead to higher Canadian household debt and, in turn, generate higher interest income for banks. As Senator Deacon notes, this dominance undermines the capacity to fund future industries, leaving the TSX “lifeless” even as the housing market becomes a debt-fueled bubble.
Why the CDIC Safety Net is a Psychological Sedative
While the Canada Deposit Insurance Corporation (CDIC) provides protection for deposits up to $100,000, this safety net is largely irrelevant to the current crisis. The CDIC protects the money you have in the bank; it does nothing for the money you owe the bank. For a household with $15,000 in savings but an $800,000 mortgage, the “safety” of the banking system is a psychological sedative. It masks a precarious reality: the bank’s balance sheet is protected by federal regulation and taxpayer-backed insurance, but the family’s net worth is one renewal away from turning negative.
Conclusion: A System Working Exactly as Designed
The final verdict on the Canadian economy is not one of systemic failure, but of systemic design. Canada’s banking system is safe because households are exposed. The regulatory architecture ensures that institutions are well-capitalized, diversified, and protected by government-backed insurance. However, this very safety has provided the “easy credit” fuel for a historic accumulation of Canadian household debt.
As we move through the 2025-2026 renewal cycle, the divergence between record bank profits ($19 billion in Q1 2026) and rising delinquency rates will only grow more pronounced. The system is functioning exactly as it was built: to protect the state’s core institutions at the expense of the individual’s balance sheet. Ultimately, there is a profound difference between a well-capitalized bank and a sustainable household.
——————————————————————————–
Frequently Asked Questions
Is the high level of Canadian household debt a risk to the banks? While debt levels are at record highs, the risk to banks is mitigated by 150 years of structural stability, OSFI’s strict capital requirements, and the fact that high-ratio mortgages are insured by the CMHC, thereby shifting default risk to taxpayers.
How does Canada’s banking system compare to the US in a crisis? Canada uses a concentrated oligopoly model with a single federal regulator (OSFI), whereas the US system is fragmented with thousands of smaller banks. This allows Canadian banks to diversify risk nationally and avoid the regional collapses common in the American system.
What is the “Renewal Shock” mentioned in recent reports? The “Renewal Shock” refers to the 1.2 million Canadian mortgages (60% of the market) renewing in 2025-2026. These borrowers are seeing interest rates jump by 200-300 basis points, significantly increasing their monthly payments and pressuring disposable income.