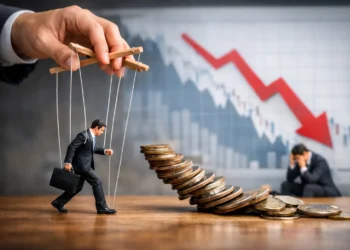
A recession can dominate headlines long before one appears in the data. A strong jobs report can do the reverse: prompt declarations that everything is fine while households are quietly putting more on credit cards. Both reactions confuse a data point with a diagnosis.
Economic outlook indicators are useful precisely because they force a wider view. No single number can tell us where the economy is headed. The better question is whether several measures, across households and businesses, are pointing in the same direction. That sounds less satisfying than a clean headline. It is also much closer to reality.
Why one “good” number rarely settles the argument
Economic statistics do not arrive as a neat, final verdict. They are released at different speeds, revised later, and measured in different ways. Employment data may look healthy because hiring remains broad, while consumer spending weakens because households are drawing down savings. Inflation may fall even as housing costs remain painful. Both can be true.
This is where public narratives often go off the rails. People see a stock-market rally and assume it proves the economy is thriving. Or they see high grocery prices and conclude a collapse is underway. Markets reflect expectations and corporate profits. Grocery bills reflect a very real household budget constraint. Neither, alone, describes the entire economy. Shocking, but the economy declined to become a single chart for our convenience.
The most useful approach is to group indicators by what they reveal: current activity, financial stress, business confidence, and likely future demand. Here are seven that deserve attention.
1. Employment growth and unemployment
Jobs are usually the first place people look, and for good reason. A person with steady work is more likely to spend, pay bills, and keep a mortgage current. Payroll growth, the unemployment rate, labor-force participation, and weekly unemployment claims together give a clearer picture than any one of them alone.
But employment is a lagging indicator. Employers tend to delay layoffs until weaker sales persist, especially after periods when hiring was difficult. An unemployment rate can remain low even as hiring slows, hours are cut, or workers take jobs below their skill level.
Watch the direction, not merely the level. A low unemployment rate that starts rising consistently, alongside softer hiring and rising initial jobless claims, matters more than a single monthly payroll surprise. In the United States, the Bureau of Labor Statistics data is the central reference point. In Canada, Statistics Canada provides the equivalent labor-market picture.
The question beneath the headline
Are employers still adding workers because demand is genuinely holding up, or are they simply reluctant to let go after years of labor shortages? The answer changes the outlook.
2. Real wage growth
Pay raises sound encouraging. What matters is whether wages are rising faster than prices. Real wage growth measures the change in purchasing power after inflation. It is one of the clearest bridges between macroeconomic headlines and ordinary life.
Subscribe To Our Newsletter!
When nominal wages rise but rent, food, insurance, and debt payments rise faster, consumers do not experience an improving economy. Conversely, when inflation cools while pay continues to grow, households may regain room in their budgets even if prices never return to their old levels.
This distinction helps explain why sentiment can remain weak during periods of positive economic data. Inflation falling from 8 percent to 3 percent means prices are rising more slowly. It does not mean the price level has reset. People are not irrational for noticing that distinction.
3. Consumer spending, adjusted for inflation
Consumer spending drives a large share of economic activity in both the United States and Canada. Yet headline retail sales can mislead because they are typically reported in nominal dollars. If prices rise, sales totals may increase even when people are buying fewer goods.
The more revealing measure is inflation-adjusted consumer spending, along with the composition of that spending. Are households buying discretionary items, or concentrating on essentials? Are services such as travel and restaurants holding up? Is spending supported by income, savings, or borrowing?
A modest slowdown in spending is not automatically alarming. Households may simply be normalizing after an unusually strong period. The warning sign is a broad pullback combined with weakening income and rising reliance on debt.
4. Credit stress and delinquency rates
Credit is where economic pressure often becomes visible before it becomes politically convenient to acknowledge. Rising delinquencies on credit cards, auto loans, and other consumer debt can show that a segment of households is no longer absorbing higher prices and interest rates easily.
This indicator needs context. Delinquency rates rising from unusually low levels do not necessarily signal a systemic crisis. The post-pandemic period created some distorted comparisons, including excess savings and unusually generous relief programs. A return toward historical norms may be uncomfortable without being catastrophic.
Still, the distribution matters. If lower-income borrowers are struggling while aggregate consumption remains strong, the economy can look fine from 30,000 feet and feel decidedly less fine near the ground. That gap is not a contradiction. It is an average doing what averages do: concealing variation.
5. Housing activity and affordability
Housing is both an economic sector and a household balance-sheet issue. New construction, existing-home sales, mortgage applications, home prices, rents, and delinquency rates all offer different clues.
High interest rates can suppress home sales without producing a steep price decline, particularly where supply is tight. Existing owners with low fixed mortgage rates may simply refuse to sell, reducing inventory and freezing the market. That can make housing data look weak in terms of transactions while prices remain stubbornly high.
For the outlook, pay attention to construction and affordability as much as prices. Falling housing starts can weaken future construction employment and related spending. Persistent affordability problems can limit household mobility, delay family formation, and keep pressure on renters. Housing does not need to crash to drag on growth.
6. Business investment and manufacturing orders
Businesses reveal their expectations through capital spending. When companies invest in equipment, software, facilities, and inventory, they are usually betting that future demand will justify it. When they pull back, they may be anticipating slower sales or protecting cash flow.
Manufacturing surveys and new-orders data are useful early signals, but they should be handled carefully. Manufacturing is a meaningful part of the economy, not the whole economy. A weak factory survey can coexist with resilient service-sector activity.
The stronger signal comes when business investment, new orders, and hiring intentions all weaken together. That combination suggests caution has moved beyond a temporary inventory adjustment. On the other hand, investment tied to automation, energy, infrastructure, or data centers may remain strong even in a slower broad economy. The sector matters.
7. The yield curve and lending conditions
The yield curve compares interest rates on short-term and long-term government bonds. When short-term rates are above long-term rates, the curve is inverted. Historically, prolonged inversions have often preceded recessions, which is why they generate so many ominous graphics.
But “often preceded” is not the same as “caused,” and timing is notoriously unreliable. An inversion can persist for months before economic weakness becomes obvious. It is best treated as a warning about restrictive monetary conditions and market expectations, not a countdown clock.
Lending conditions add practical context. If banks tighten standards, businesses cannot finance expansion as easily and households face more difficulty obtaining mortgages, car loans, or credit. The Federal Reserve’s lending surveys in the United States and the Bank of Canada’s credit conditions reporting help show whether higher policy rates are actually reaching the real economy.
Reading economic outlook indicators as a system
The value of these indicators is not in predicting the exact month of a downturn. Anyone claiming that level of precision is selling certainty where none exists. Their value is in identifying whether the economy is broadening, slowing gradually, or developing stress beneath a superficially healthy headline.
A constructive outlook might show stable employment, real wage gains, manageable delinquency rates, and spending supported by income rather than borrowing. A more fragile one might show job growth slowing, consumer debt stress rising, housing activity constrained, and banks pulling back on lending. Neither picture needs a dramatic label before it deserves attention.
The practical habit is simple: check whether labor, consumers, credit, housing, business investment, and financial conditions tell a compatible story. When they do, confidence in the signal rises. When they do not, resist the urge to force a conclusion.
The economy is not a mood, a campaign line, or a market ticker. It is millions of households and businesses making constrained decisions. Read the indicators with that in mind, and the noise starts to lose some of its authority.